Days in the Life of a Postdoc
03.12.2022
Elisa Granato & Christoph Ziegenhain
A recurring topic of conversation in academia is work-life balance and hours spent working. These conversations are often rife with claims of some individuals working extraordinarily long hours (up to 80h/week), while others report more “conventional” times (~40h/week if full-time). Working long hours is often framed as necessary for being successful in a career with little to no job security, or – at the very least – a sign that a person is “highly motivated”. One problem with these narratives is that humans are notoriously bad at self-reporting. And reflecting on your own work schedule is no exception, especially for a profession like that of a researcher, where the line between work and time off is often fuzzy (e.g. when your best ideas do actually come to you in the shower). All this results in many anecdotes, and very little data.
This is where this project comes in. In late 2018, a friend and I (both freshly-minted, 1st year postdocs at the time) got curious about our own working hours, and embarked on a quest to track our work lives for a few weeks in order to generate some data on how much we actually worked. We also wanted to look at the job description itself. What does it mean to be “a postdoc”, when you are supposed to fulfil ≥ 12 different roles? Especially as these roles change with every project, change as you become more experienced, some roles are fun and some make you want to claw your eyes out, and, importantly, only some of these roles will increase your chances of landing you your next job. So not only did we track how much we worked, we tracked every minute (!) of our work days and honestly reported what we were actually doing, including break time.
METHODS
Using a time tracking app*, two postdoctoral researchers in biology at two different universities in Europe tracked their work days in small increments (minimum “session length” 30 seconds) over several weeks (6 and 11 weeks respectively). Each session was categorized into one of 12 task categories, including break time (see Figures). At the time of tracking, we were both in the same stage of our career (first year post PhD), but worked in different countries and in different sub-fields: Elisa Granato (EG): microbial ecology, Oxford, UK. Christoph Ziegenhain (CZ): single-cell genomics, Stockholm, Sweden. (*the app does not exist anymore, but Toggl Track offers the same functionality)
RESULTS
Total work hours and work patterns differ strongly between individuals
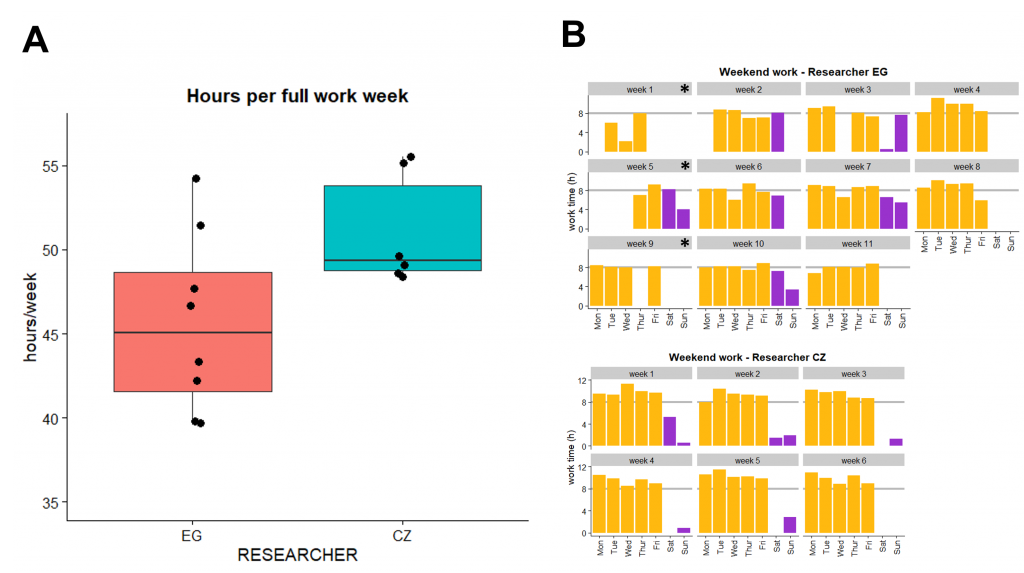
In fully tracked weeks (i.e. weeks with no holidays), EG worked an average of 45.7h, while CZ worked an average of 51h (including at-work break time; Fig. 1A). Of note here is the large difference in variance: EG worked anywhere from 39 to 54 hours, while CZ rarely deviated from his average. When looking at how hours are distributed between regular workdays and the weekend (Fig. 1B), more differences become apparent: EG regularly worked full days on weekends (purple color), and often compensated by taking weekdays off (yellow). In contrast, CZ largely followed a more traditional Mo-Fr routine, but still logged a few odd hours on weekends. These differences are partially driven by the nature of the work, and our private circumstances. EG’s research at the time was largely independent of other people, which led to near complete flexibility and a strong incentive to work on weekends when equipment (e.g. microscopes) and laboratory space was more freely available. In contrast, CZ’s work was more strongly embedded in a team, making shared work hours with colleagues more valuable. EG also lived alone at the time whereas CZ lived with his partner, making weekend work less attractive for CZ.
Work pattern differences extend to daytime distributions
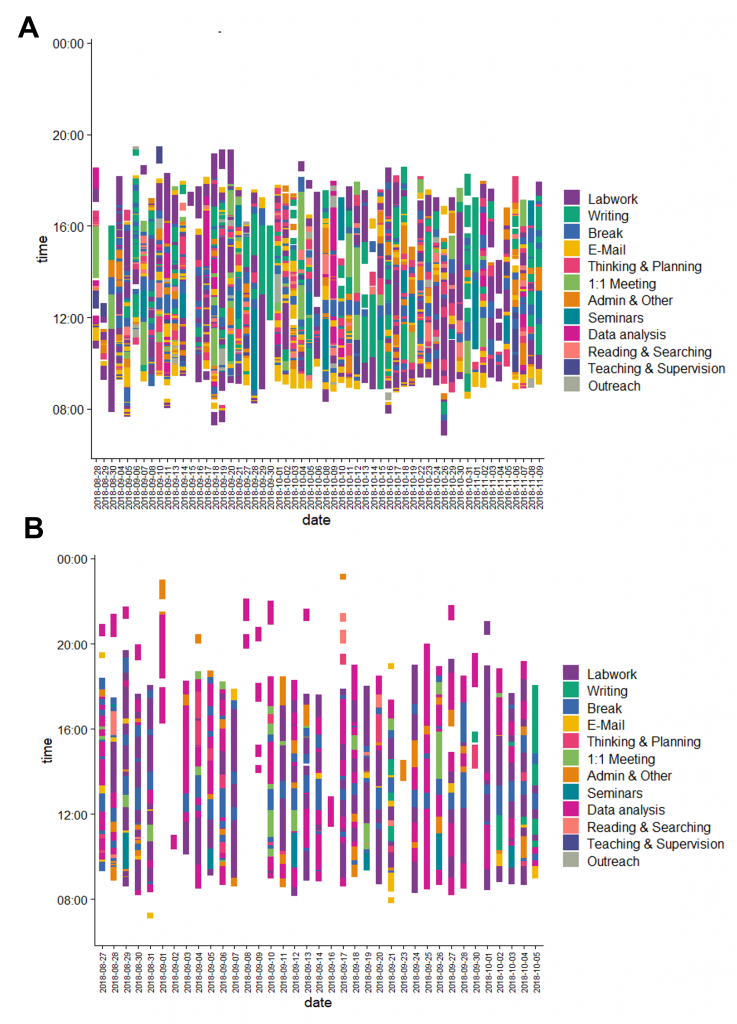
When looking at the tracking data for different activities on each tracked day (Fig. 2), we observed that we structured our days in very different ways. EG largely followed a traditional 9-to-5 format, including when working on weekends. In contrast, CZ both started earlier and worked later on most days, and on days with minimal work that work was mostly restricted to late in the evening. Some of these differences likely boil down to what kind of research is conducted. EG works in microbiology, where bacterial cultures can be grown overnight or in periods of 24h, allowing for most experimental work to be conducted efficiently during the day, while also allowing for other (e.g. administrative) tasks to be conducted in parallel. CZ’s late-night work was mostly conducted from home, and spent on data analysis and other assorted administrative tasks that were not completed during the day. Looking at this complete dataset, it also becomes immediately obvious that we spent different amounts of time on different tasks, which we will explore next.
Different postdocs prioritize different tasks
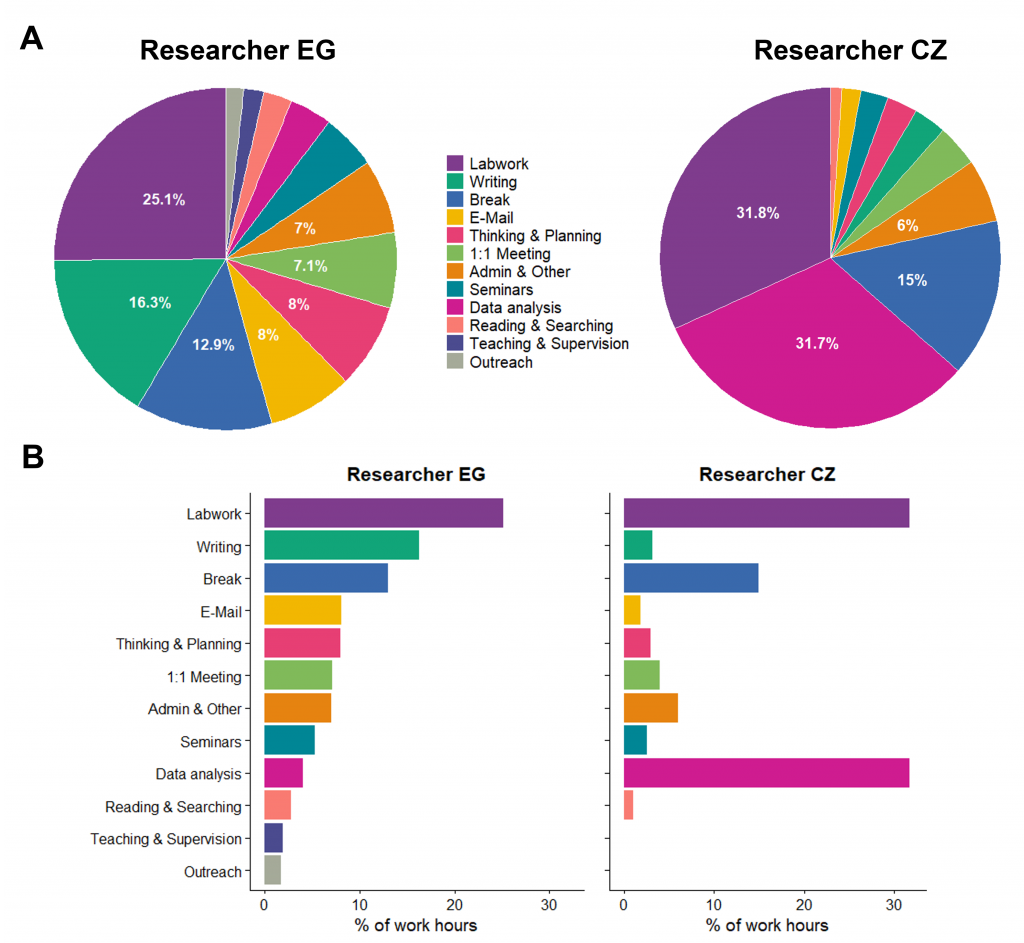
Fig. 3 shows how we split our time among different task categories. Unsurprisingly, being wet-lab researchers, “lab work” took up most of our time (25% for EG and 32% for CZ). But this is where the similarities end. Writing (manuscripts, grants etc.) took up over 16% of EG’s time, but only 3% of CZ’s. In contrast, CZ spent 32% of his time on data analysis, compared to only 8% for EG. Since CZ’s work has a large computational component, this was to be expected. Interestingly, EG spent roughly three times as much time on “Thinking and planning” than CZ, and four times as much time on emails. If we consider only lab work, data analysis and writing as “core research activities”, we observed a pattern of EG devoting more time to non-core-research tasks, spending just 46% of her work hours on core research compared to 63.5% for CZ. Of note: despite our differences in work style, we both spent a roughly equal amount of time taking breaks (13-15%; equivalent to ca. 67 min of break time in an 8h day).
Task prioritization is largely consistent over time
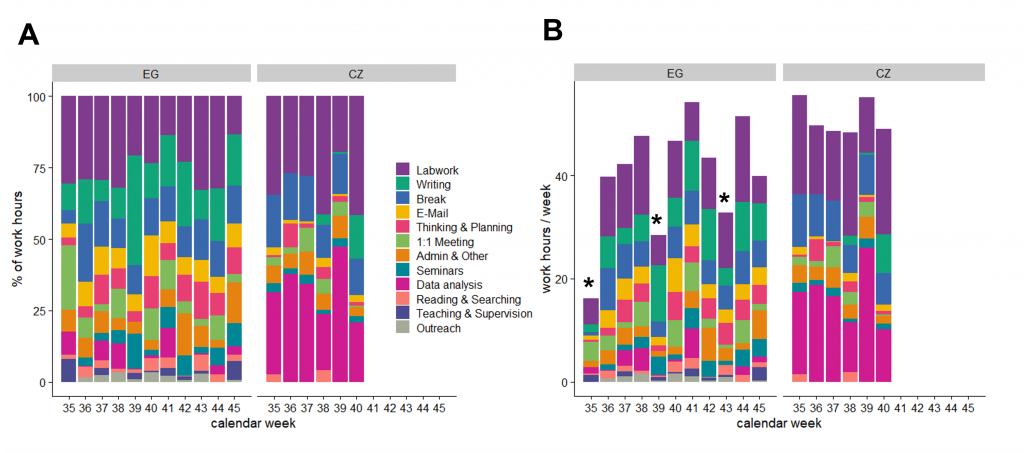
When looking at how work patterns compare across different tracked calendar weeks (Fig. 4), we observed that they were largely consistent: CZ spent the vast majority of his time on lab work and data analysis, regardless of the specific week. Similarly, EG’s time was highly fragmented into different task categories, with lab work and writing being the dominant categories most weeks (Fig. 4A). Looking at absolute hours worked per week (Fig. 4B) again highlights that CZ spent a consistent amount of time working, while EG’s weekly work hours varied considerably from one week to the next.
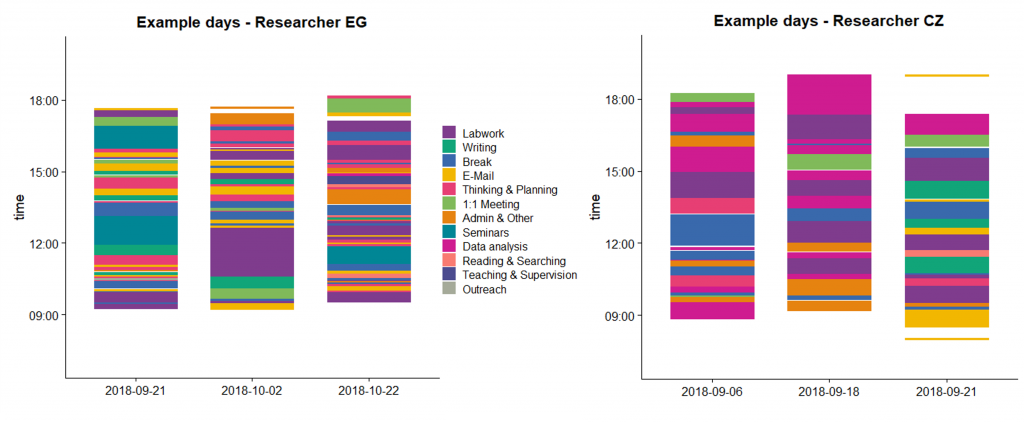
Academic work days are highly fragmented
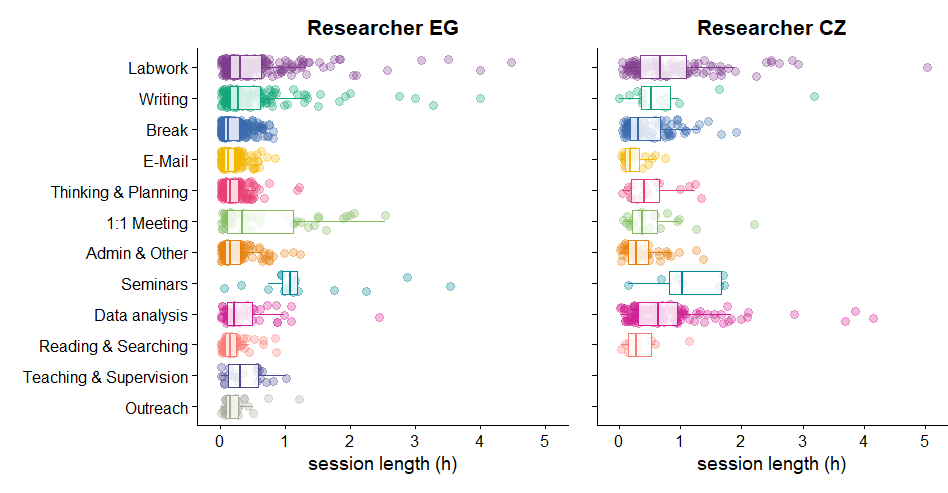
Zooming in on individual work days (Fig. 5) allows us to get a sense of how work days are structured at short timescales. What stands out immediately is how fragmented academic work days can be. Vastly different categories of tasks are tackled in rapid succession, and only a handful of blocks show evidence of focus on a given task for >1h. This becomes even more obvious when we look at average uninterrupted session lengths per task category (Fig. 6).
Here we see that median session length for all task categories except seminars is <1h. This includes activities like writing, thinking, and reading, which are most likely to benefit from deep immersion and focus.
CONCLUSIONS
This snapshot data set from our 1st year as postdocs suggests that neither of us was working anywhere close to the infamous 80h/week mark, but we were still working a lot. EG worked fewer hours on average, and frequently oscillated between very short and very long days. We speculate that this pattern was heavily influenced by energy levels, mood and – of course – deadlines. It is worth mentioning that both of us take plenty of holidays every year, so these few weeks of time tracking definitely do not represent the entirety of our work schedule. We also had near complete freedom to choose our hours: none of our workplaces / contracts dictated core office hours or anything like that. This means that our relatively long hours were likely mostly driven by a vague sense of pressure to be productive in our research, which is probably felt by many postdocs. One extremely important caveat for the hours/week data and -discussion is that quantity is not quality! Just because people work long hours does not mean they are productive during those hours. Our time tracking method does not take into account intensity, productivity, focus etc., which are of course crucial determinants of i) how much we got done per hour and ii) how tired that hour made us. In terms of productivity per spent time, we ask ourselves whether the fast-paced, highly fragmented workdays we often experience are an effective way to do research.
Another key take-away from this study is that the very nature of the job entails that everyone’s responsibilities and personal preferences are different, and people in the same career stage might have extremely different work patterns. There are many things that will affect how postdocs spend their time: the project specifics, the subject field, the researcher’s duties, priorities, personality, private life and more. All of these are reflected in the work pattern differences between EG and CZ. Additionally, this dataset represents only a few weeks of our lives, but projects and duties turn over rapidly. For example, EG happened to write up a paper at the time, CZ did not, resulting in much less time spent writing.
At this point it is vital to mention that we are both incredibly privileged in many ways: we are both able-bodied, when we tracked our time neither of us had caring responsibilities, and we were surrounded by incredibly supportive colleagues – and advisors – who made spending time in the lab or the office fun and enjoyable. We were also both in the lucky position to have significant freedom when it came to making our own schedule, which can be one of the best things about being a postdoc. Once we were done with our PhDs, coursework and thesis writing was largely behind us. At the same time, our lives were not yet dominated by meetings and administrative responsibilities as much as they are for group leaders / professors.
To conclude – what has emerged from this project is that i) we were probably working a bit too much (but not even close to 80h/week!), and ii) that there really is no such thing as a “typical” postdoc day or week. Importantly, what we have reported here is neither ideal, nor representative. It is simply what we did and what worked ok-ish for us at the time. There is no recipe that works for everyone, you have to find what works for you. Personally, we found time tracking to be a useful tool to figure out where our time goes, and a great starting place for managing our work days a bit better. Looking back at the data now – 4 years later – it is also very obvious to us that our lives do not look like this anymore. We are now what we lovingly call “late-stage postdocs”, with more responsibilities but also more experience under our belts. To highlight those differences, we are currently working on a follow-up post, where we compare the lives of 1st-year postdocs to those of 5th-year postdocs. Stay tuned!